


Visualize and understand your Java code execution like never before
Latest Version: 2.1.2, released on 13.08.2026 (Changelog).
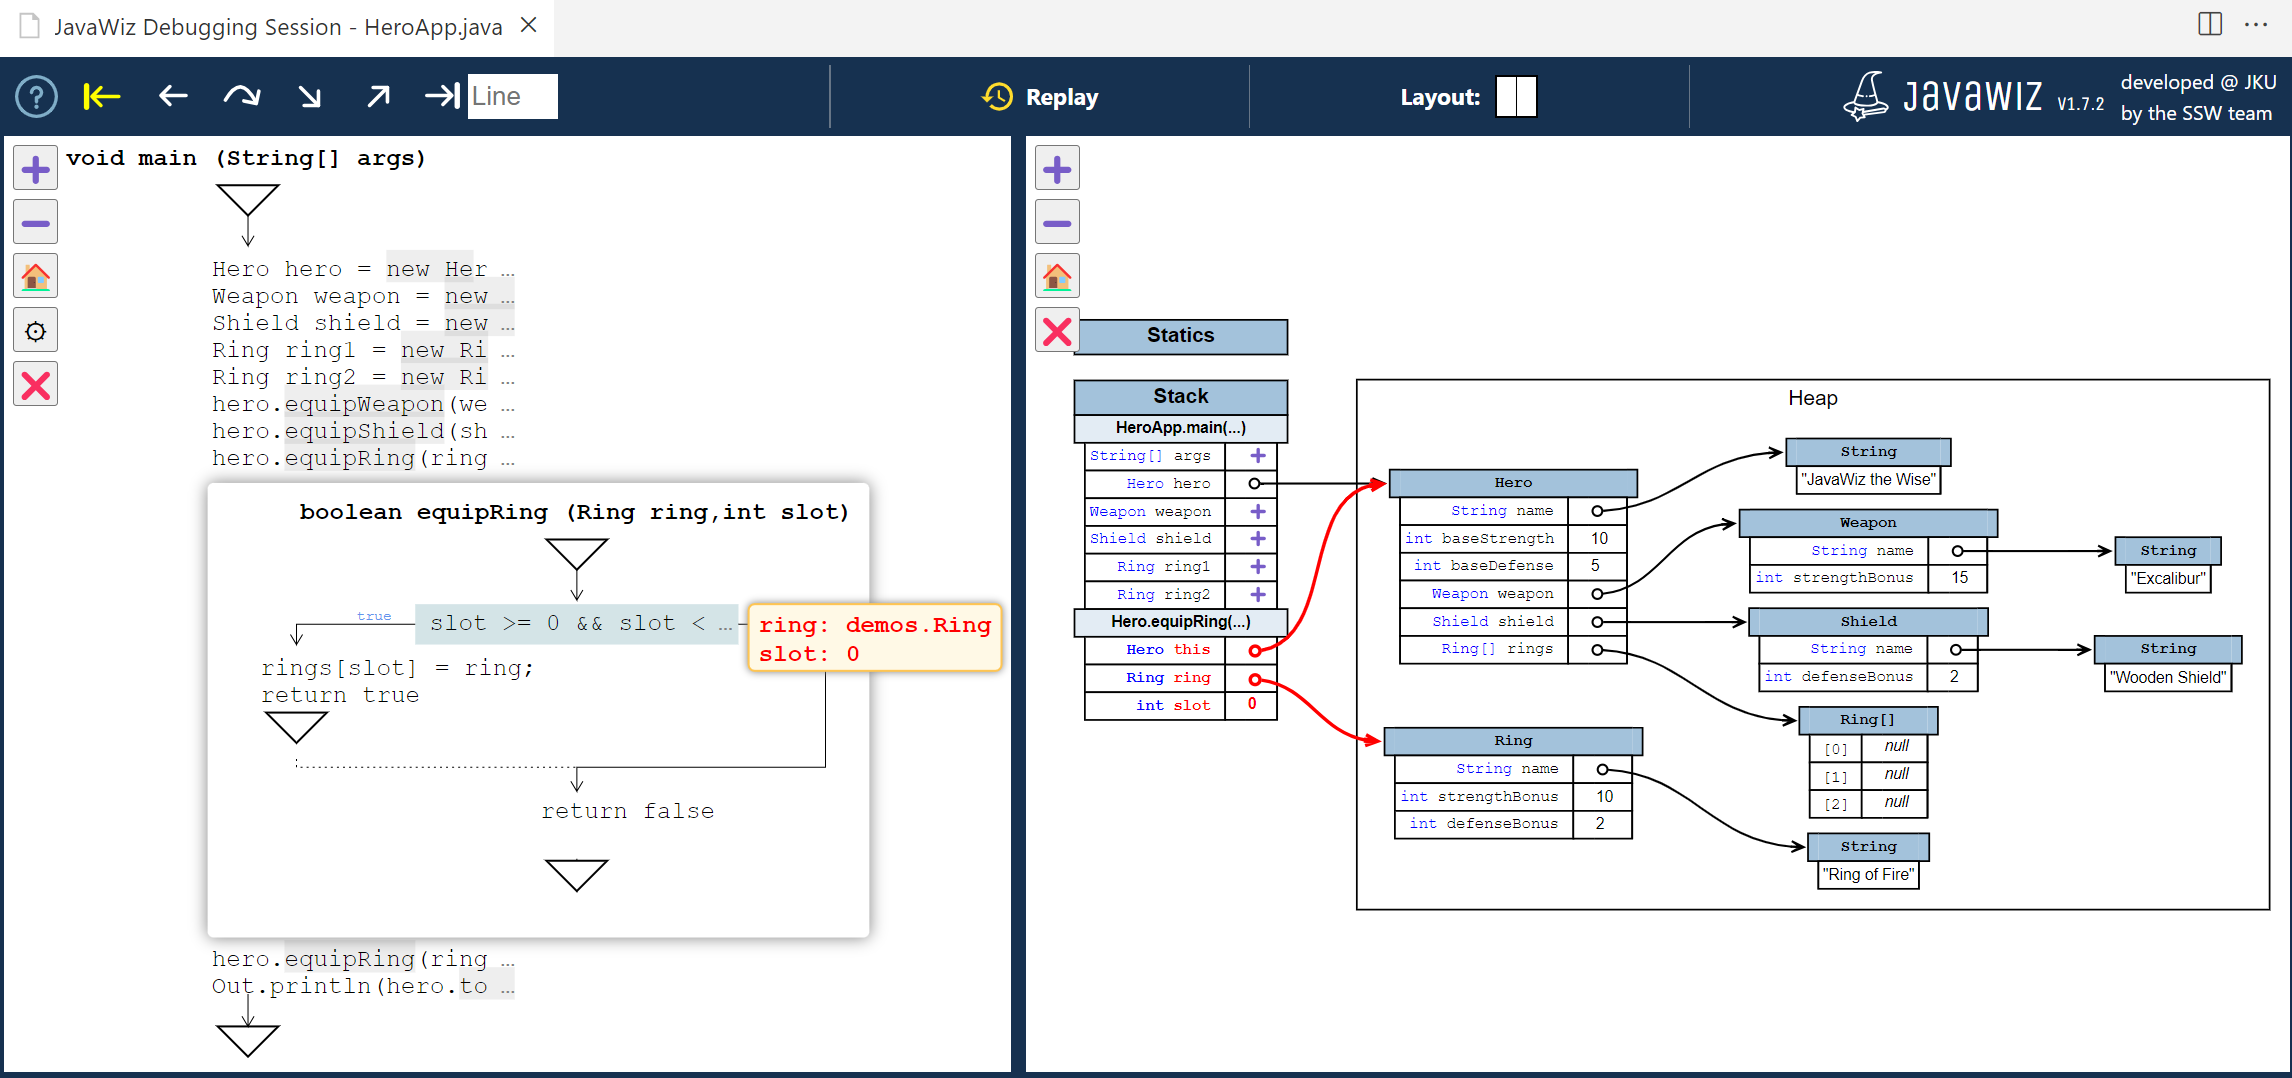
JavaWiz provides ten synchronized visualization views: Flowchart, Memory, Tabular, Array, Linked List, Binary Tree, Sequence Diagram, Input, Java Stream, and History.
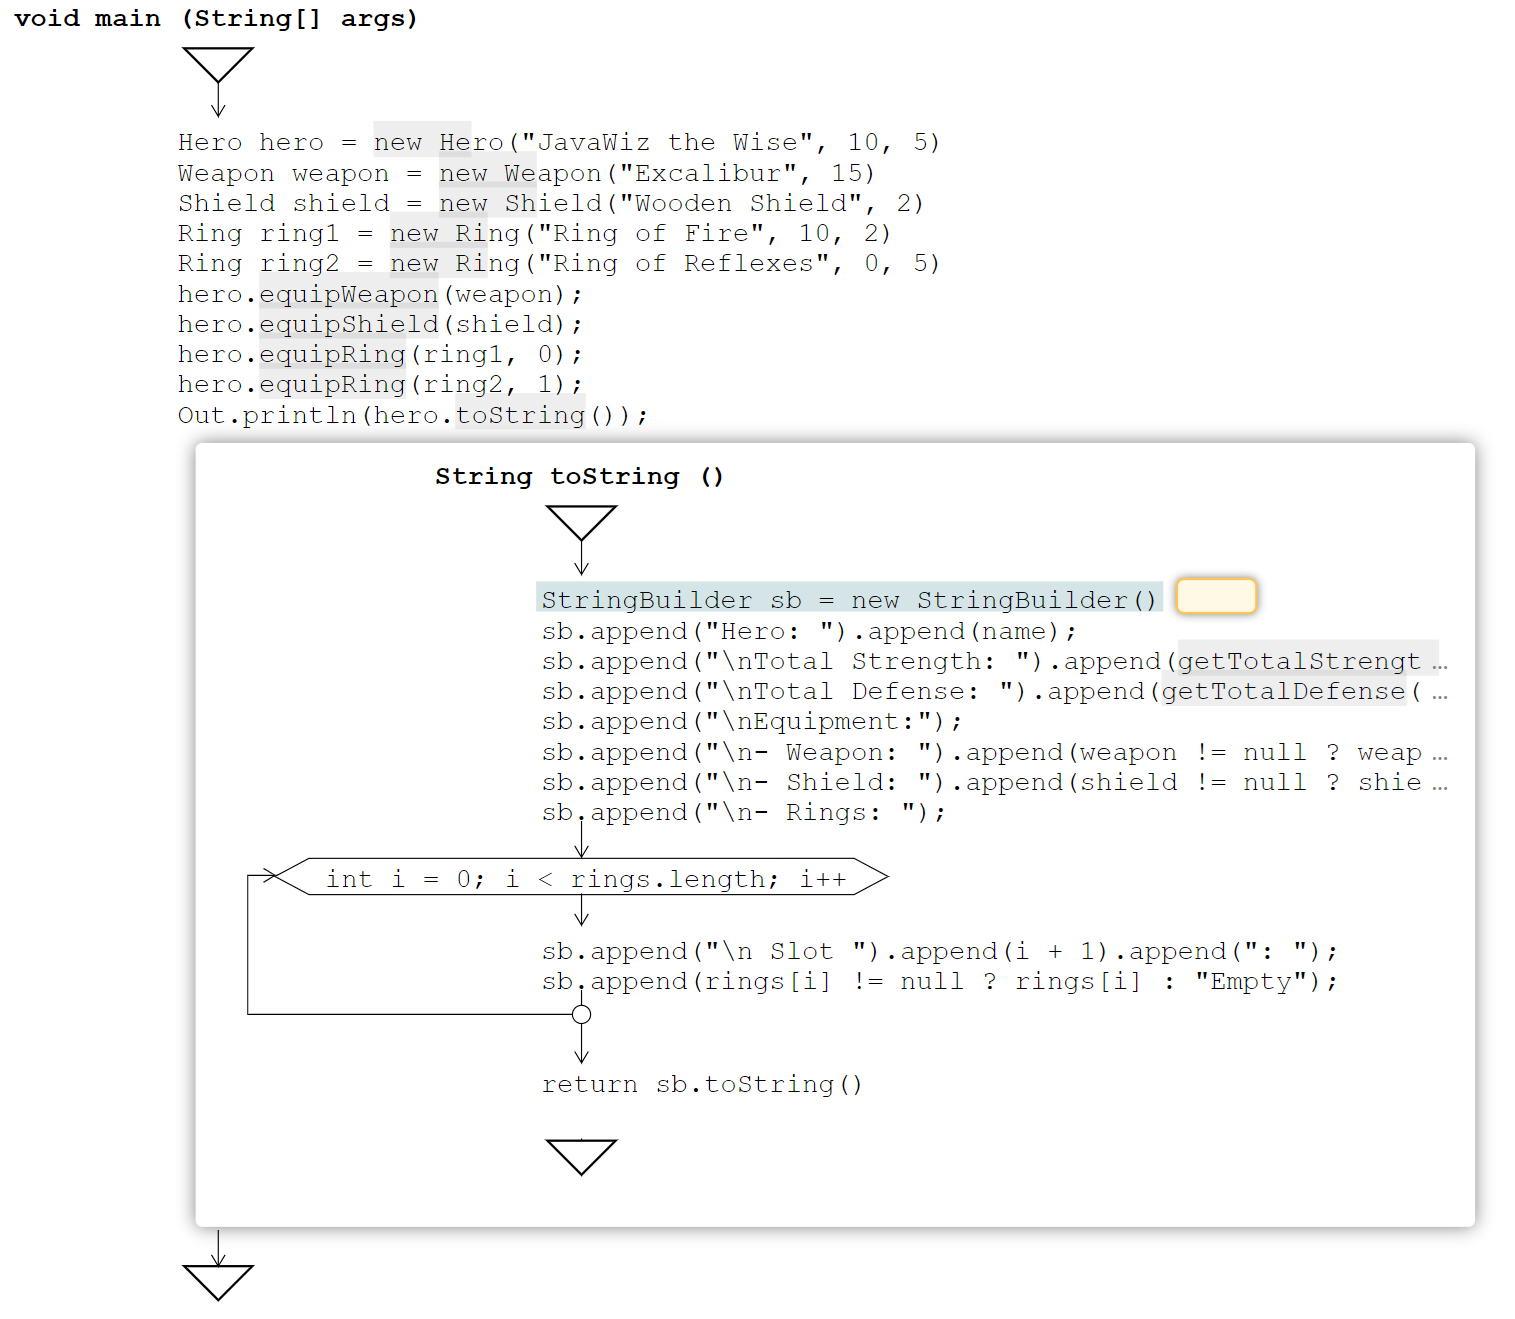
A dynamic flowchart representation of your program's control flow. It highlights the active statement, displays current variable values, and allows collapsing/expanding elements and method calls for better overview.
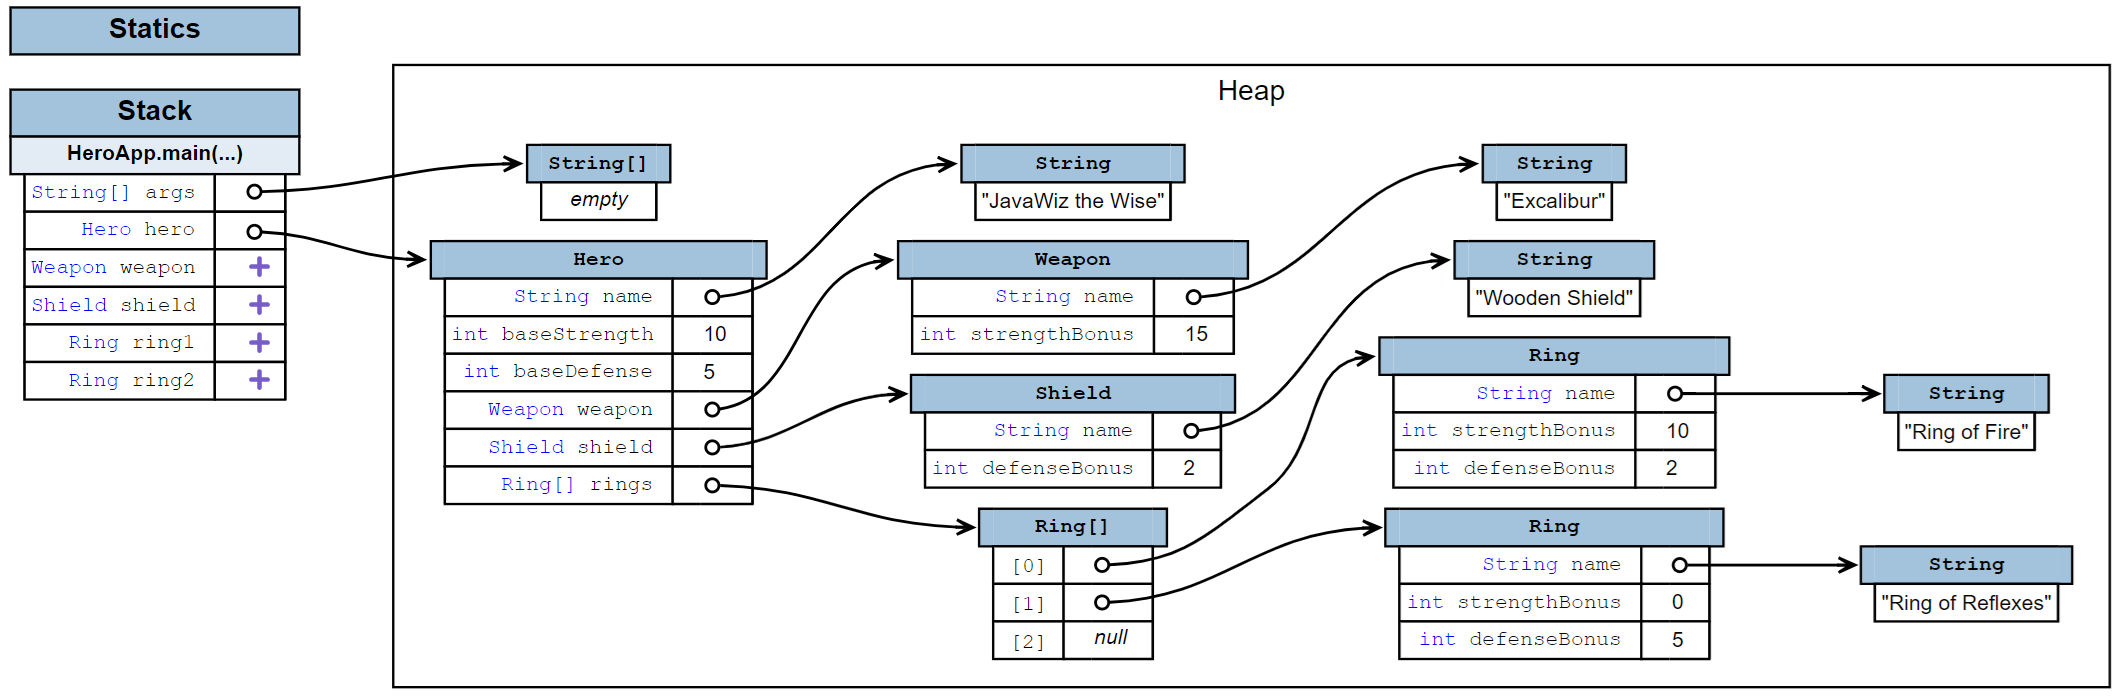
Visualizes the program's memory state including stack, static variables, and heap. Perfect for understanding reference semantics and object relationships in memory.
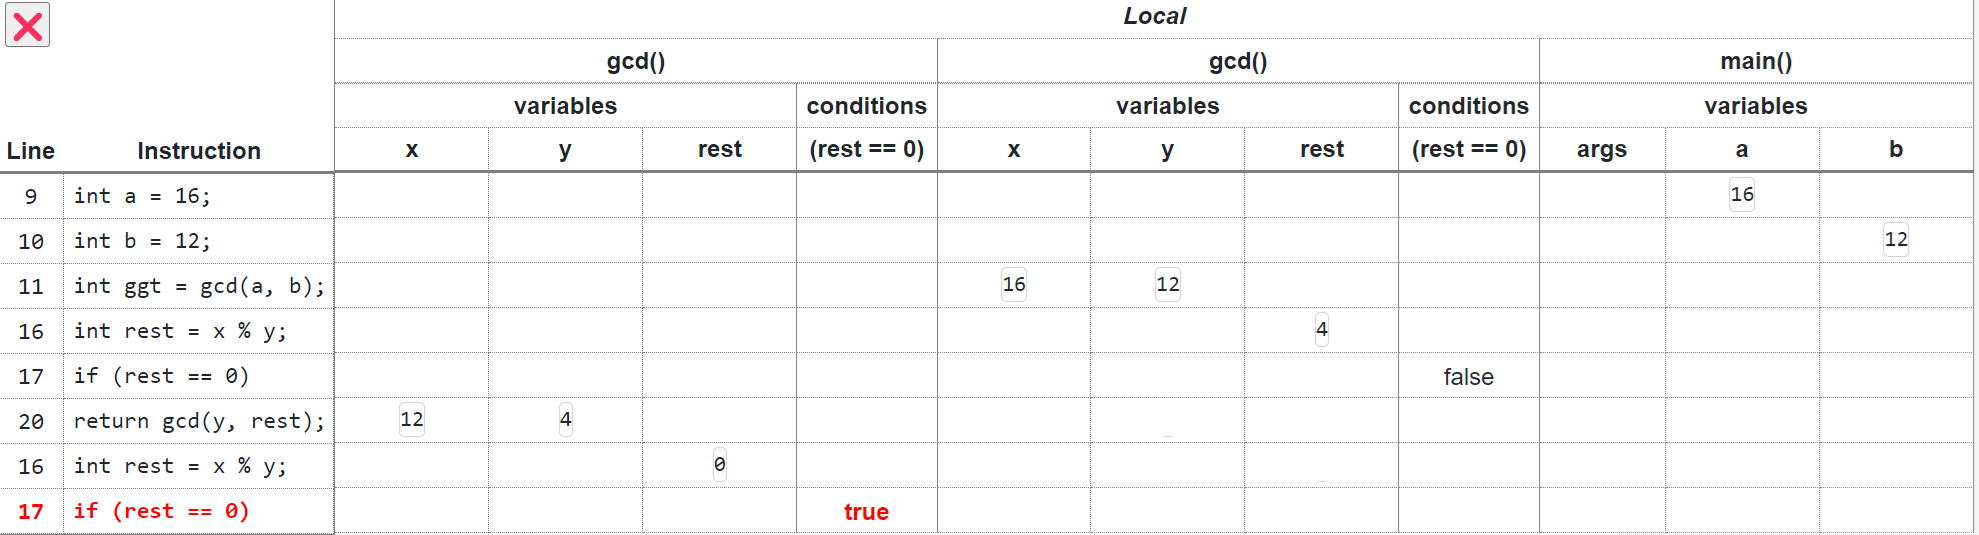
Displays program execution history in a table format, focusing on primitive value manipulations. Shows executed statements, stack variable values, and conditions of control structures.
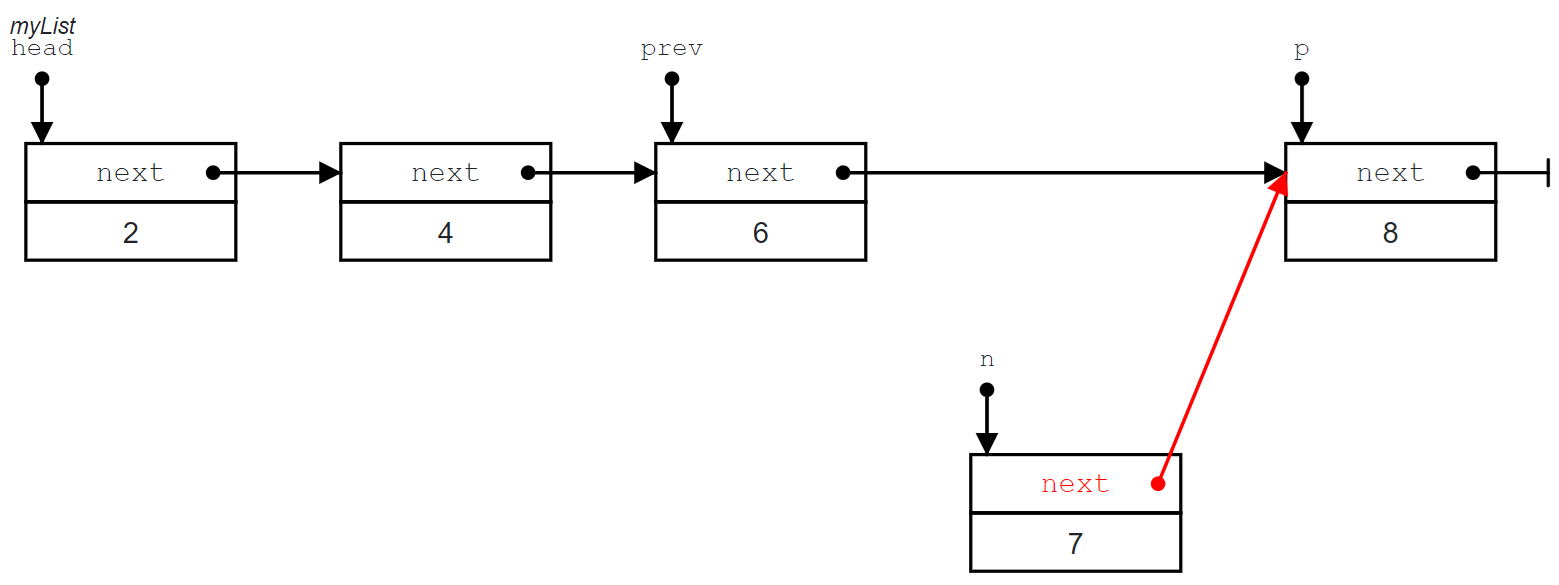
Specialized views for list and tree data structures with smooth animations for operations such as insertions and deletions. Shows local node variables alongside referenced nodes, making traversal algorithms easier to understand.
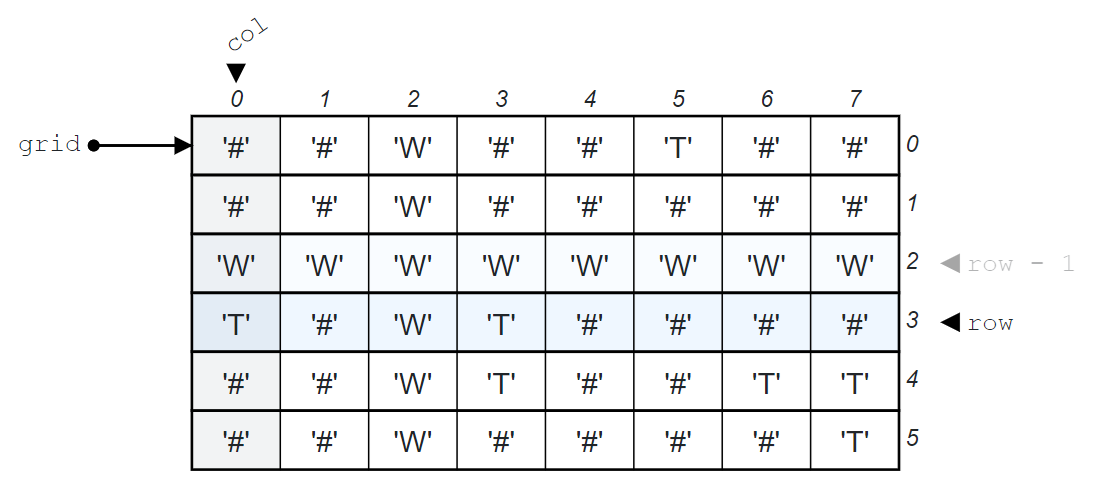
Visualizes arrays as interactive tables with animated index expressions and assignments. Perfect for understanding array operations and data flow between array elements and variables.
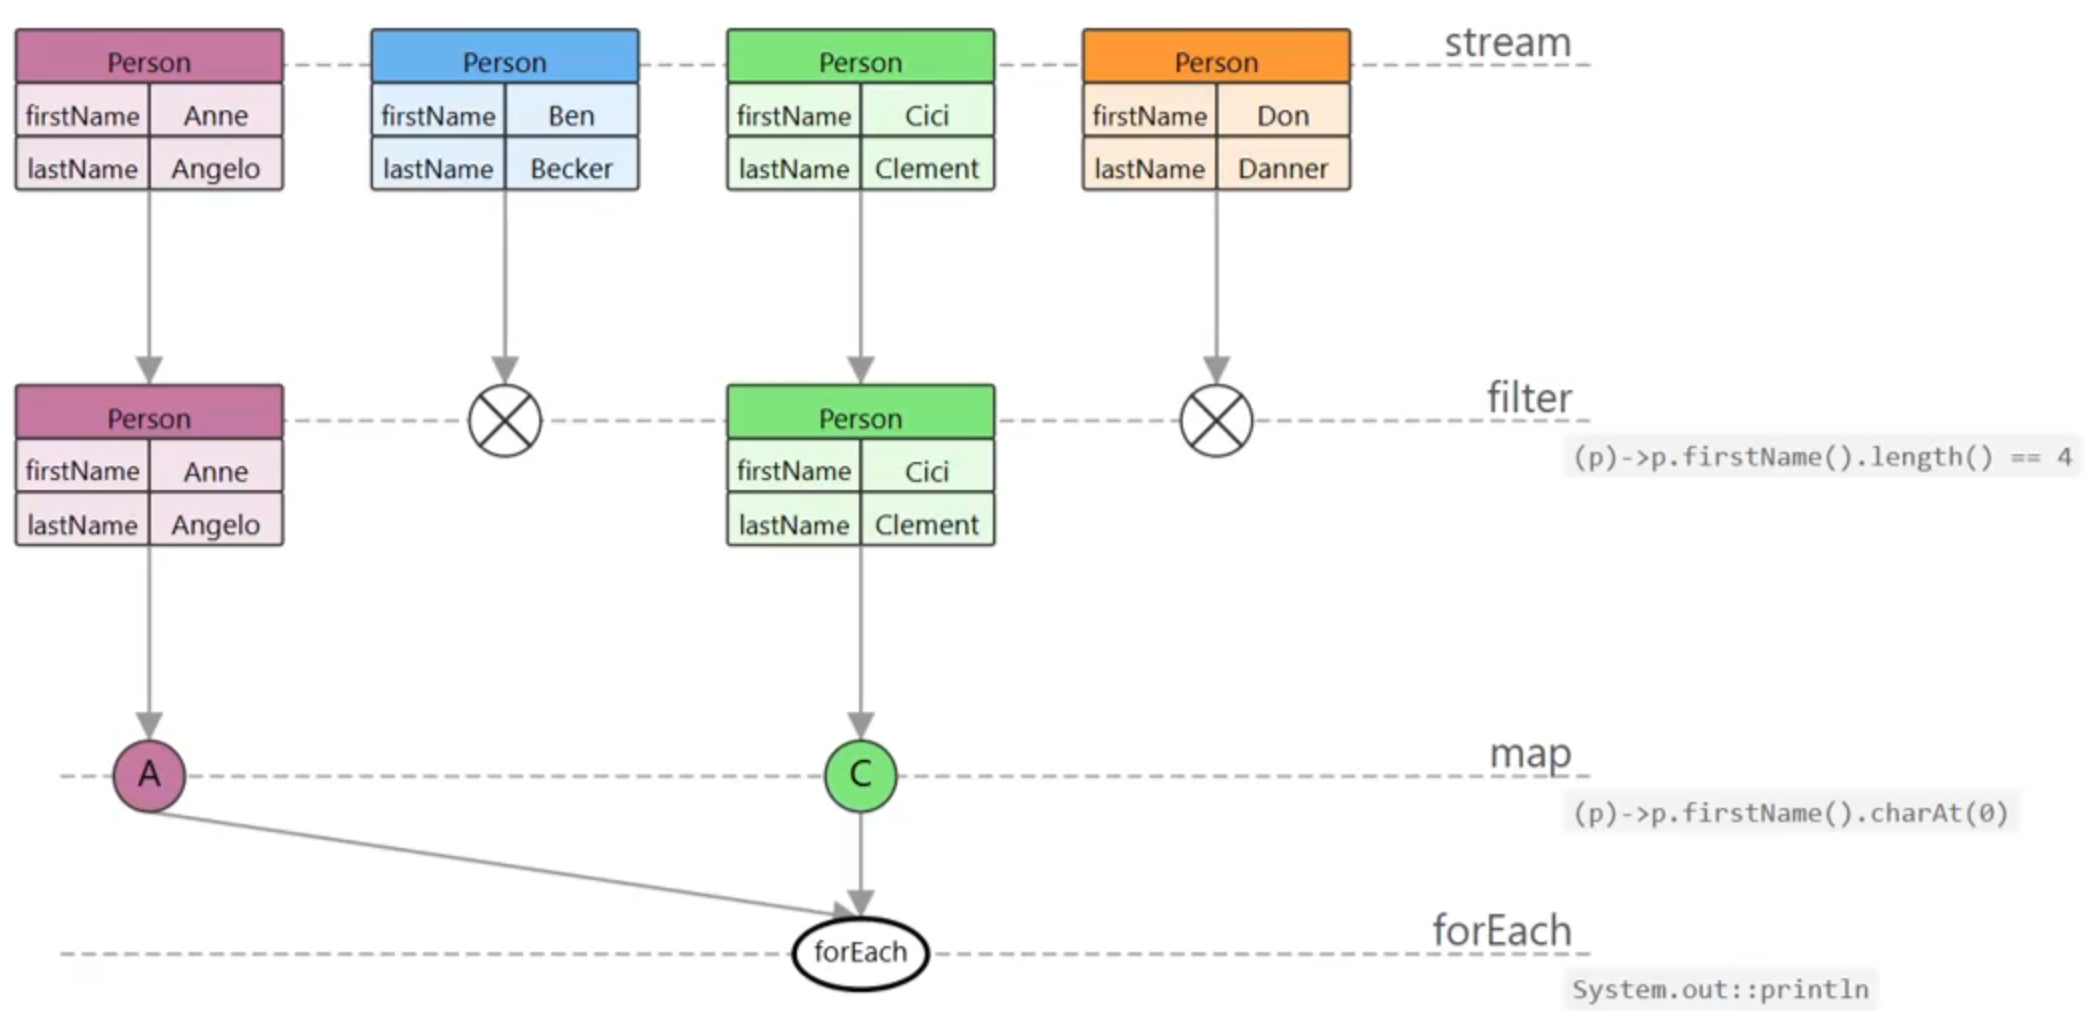
Visualizes Stream pipelines as dynamic Marble Diagrams, showing execution order, intermediate results, and transformations. Links between elements reveal their lineage across filtering, mapping, and terminal operations.
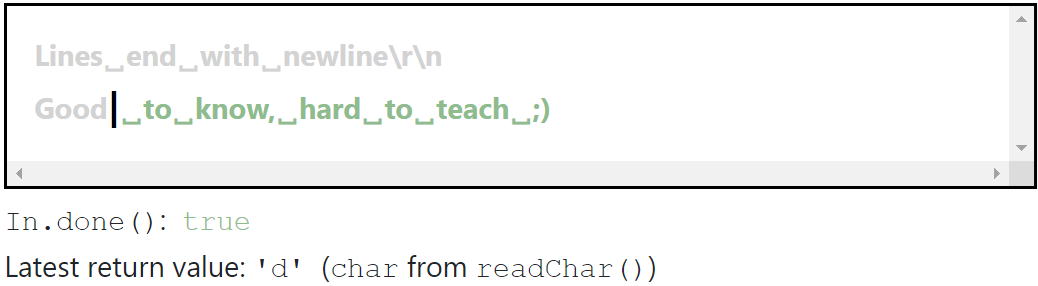
Visualizes the input buffer's state using a special In.java class, showing consumed and unconsumed parts.
Displays the latest operation's return value and success status, helping beginners understand input operations.
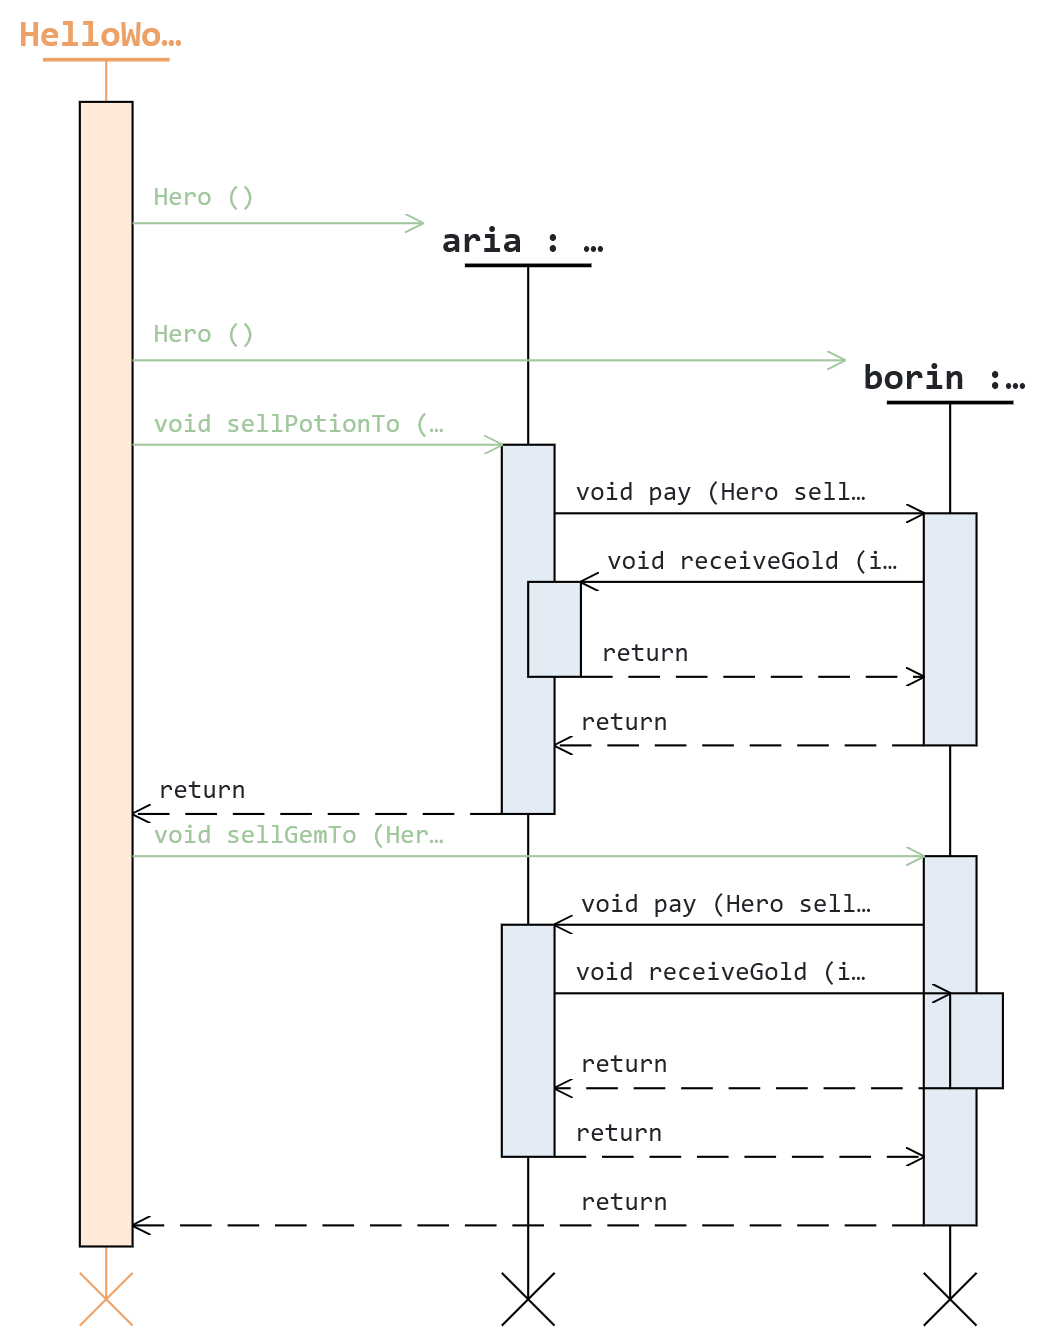
Shows objects, method calls, returns, and lifetimes over the course of the execution. This makes object interactions and nested call sequences easier to follow.
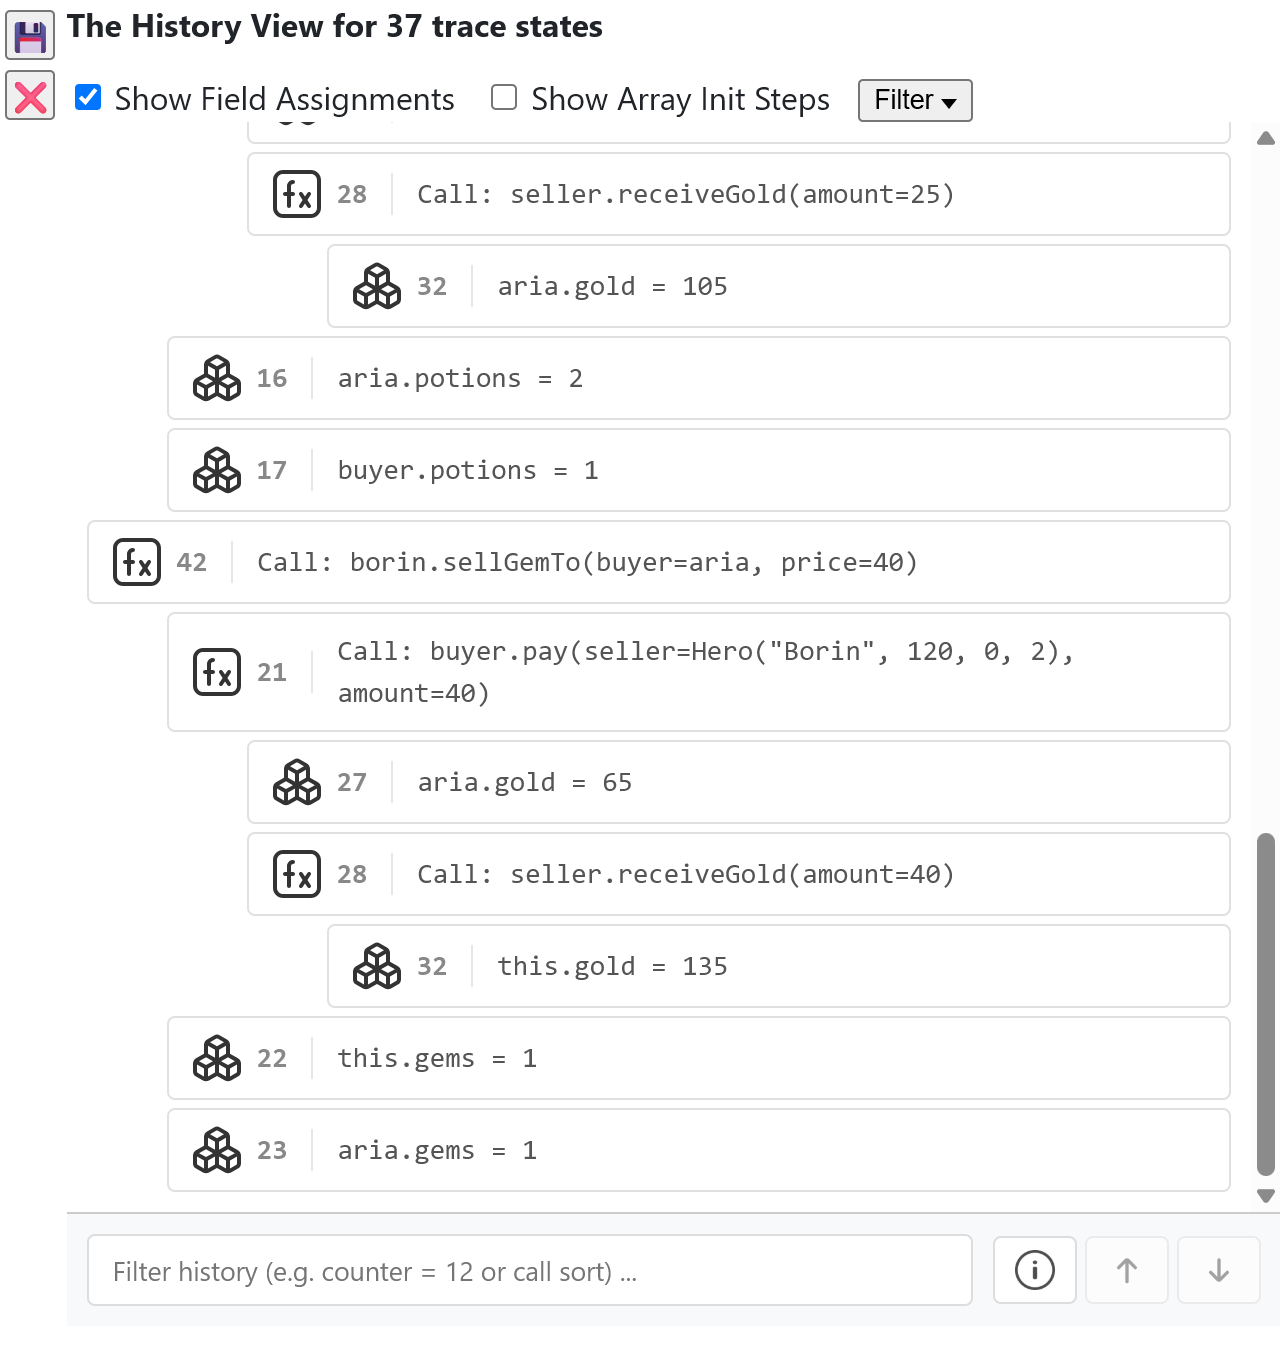
Presents calls, constructors, initializers, and assignments to variables, fields, and array elements across the complete execution trace. Filter or search the history and jump directly to any matching program state.
Weninger, Markus; Grünbacher, Simon; Prähofer, Herbert
Proceedings of the 33rd IEEE/ACM International Conference on Program Comprehension (ICPC 2025), April 27-28, 2025, Ottawa, Canada.
Software development education faces challenges in teaching abstract and complex programming concepts. Since problems in comprehension can lead
to decreased student engagement, we introduce JavaWiz: an educational graphical debugger that addresses these challenges by combining
traditional debugging functionality with intuitive, dynamic visualizations of program state and run-time behavior.
JavaWiz's key features include real-time visualization of heap, stack, and static fields; automatically generated flow charts; interactive
representations of data structures; and unique time-travel debugging capabilities. Its step-by-step visual exploration of code execution,
including the ability to step backward, bridges the gap between abstract concepts and concrete program understanding.
We present the tool's visualization components in detail and discuss its applications in teaching. Lecturers report positive influence on their
in-class demonstrations and initial student feedback reinforces the tool's usefulness for program comprehension.
Weninger, M., Grünbacher, S., & Prähofer, H. (2025). JavaWiz: A Trace-Based Graphical Debugger for Software Development Education. In Proceedings of the 33rd IEEE/ACM International Conference on Program Comprehension (ICPC@ICSE 2025). Ottawa, Canada.
@inproceedings{Weninger-JavaWiz-2025,
author = {Markus Weninger and
Simon Gr{\"{u}}nbacher and
Herbert Pr{\"{a}}hofer},
title = {{JavaWiz: {A} Trace-Based Graphical Debugger for Software Development Education}},
booktitle = {{33rd {IEEE/ACM} International Conference on Program Comprehension (ICPC@ICSE 2025), Ottawa, ON, Canada, April 27-28, 2025}},
pages = {1--12},
publisher = {{IEEE}},
year = {2025},
url = {https://doi.org/10.1109/ICPC66645.2025.00023},
doi = {10.1109/ICPC66645.2025.00023},
biburl = {https://dblp.org/rec/conf/iwpc/WeningerGP25.bib}
}
Sen, Melissa; Weninger, Markus
Proceedings of the 40th European Conference on Object-Oriented Programming (ECOOP 2026), June 29-July 3, 2026, Brussels, Belgium.
Programming novices often face difficulties understanding how multi-threading works. Visual debuggers such as JavaWiz can support beginners by
providing dynamic visualizations of a program's behavior, however, they usually only work for single-threaded programs. This paper presents
ThreadViz, an extension of JavaWiz to support visualizing multi-threaded Java programs.
In ThreadViz, thread information is collected for visualization by using the Truffle Debug API. Instead of real concurrency, threads are executed
stepwise, allowing the user to determine the order of execution and preventing any unpredictable behavior. In the user interface, a unique color
is associated with each thread to illustrate the effects of different synchronization mechanisms such as locking and indicate thread state
changes. To conclude, application examples are presented to highlight the tool's capabilities.
Sen, M., & Weninger, M. (2026). JavaWiz ThreadViz - A Visual Debugger for Multi-threaded Programs Based on the Espresso Java VM. In Proceedings of the 40th European Conference on Object-Oriented Programming (ECOOP 2026). Brussels, Belgium.
@inproceedings{Sen-ThreadViz-2026,
author = {Melissa Sen and Markus Weninger},
title = {{JavaWiz ThreadViz - A Visual Debugger for Multi-threaded Programs Based on the Espresso Java VM}},
booktitle = {{Proceedings of the 40th European Conference on Object-Oriented Programming (ECOOP 2026)}},
pages = {1--6},
year = {2026},
address = {Brussels, Belgium},
url = {https://javawiz.net/paper/ECOOP_26_Preprint.pdf}
}
Weninger, Markus
Proceedings of the Fourth Workshop on Future Debugging Techniques (DEBT 2026), June 29, 2026, Brussels, Belgium.
Educators frequently use trace-based debuggers for live classroom demonstrations. Yet, if a student's attention drops during class, they have to
fall back to watching recordings (providing a passive, non-interactive experience) or replaying the debugging session at home (lacking the
instructor's pedagogical context and verbal explanations). We introduce Pedagogical Execution Traces (PETs), a concept that enriches execution
traces with explanations, highlights and interactive questions.
In this work-in-progress idea paper, we present the conceptual foundation of PETs as interactive learning artifacts, showing their applicability
within JavaWiz, an educational trace-based graphical debugger. We explore PET authoring design goals and outline ongoing work regarding
collaborative debugging scenarios and leveraging Large Language Models (LLMs) for trace annotation.
Weninger, M. (2026). Towards Guided Omniscient Debugging in Education Using Pedagogical Execution Traces (PETs). In Proceedings of the Fourth Workshop on Future Debugging Techniques (DEBT 2026). Brussels, Belgium.
@inproceedings{Weninger-PETs-2026,
author = {Markus Weninger},
title = {{Towards Guided Omniscient Debugging in Education Using Pedagogical Execution Traces (PETs)}},
booktitle = {{Proceedings of the Fourth Workshop on Future Debugging Techniques (DEBT 2026)}},
pages = {1--4},
year = {2026},
address = {Brussels, Belgium},
url = {https://javawiz.net/paper/DEBT_26_Preprint.pdf}
}
Stiegler, Sebastian; Weninger, Markus
Proceedings of the 14th IEEE Working Conference on Software Visualization (VISSOFT 2026), September 14-15, 2026, Benevento, Italy.
Java Streams provide a declarative abstraction for data processing, but their lazy evaluation semantics make runtime behavior difficult to
observe. Traditional debuggers are poorly suited for reasoning about element-level data flow, execution order, and transformation effects in
Stream pipelines, particularly for novice programmers.
We present a trace-driven, execution-centric visualization approach that makes Java Stream execution explicit using dynamic Marble Diagrams.
We describe Marble Diagrams as a visual notation, introduce a reading strategy, and show how they can be reconstructed automatically from runtime
traces. We realize this approach as an extension of the educational debugger JavaWiz and demonstrate its applicability through representative
usage scenarios.
Stiegler, S., & Weninger, M. (2026). Dynamic Visualization of Java Stream Operations for Education Using Marble Diagrams. In Proceedings of the 14th IEEE Working Conference on Software Visualization (VISSOFT 2026). Benevento, Italy.
@inproceedings{Stiegler-JavaStreams-2026,
author = {Sebastian Stiegler and Markus Weninger},
title = {{Dynamic Visualization of Java Stream Operations for Education Using Marble Diagrams}},
booktitle = {{Proceedings of the 14th IEEE Working Conference on Software Visualization (VISSOFT 2026)}},
pages = {1--12},
publisher = {IEEE},
year = {2026},
address = {Benevento, Italy},
url = {https://javawiz.net/paper/VISSOFT_26_Preprint.pdf}
}